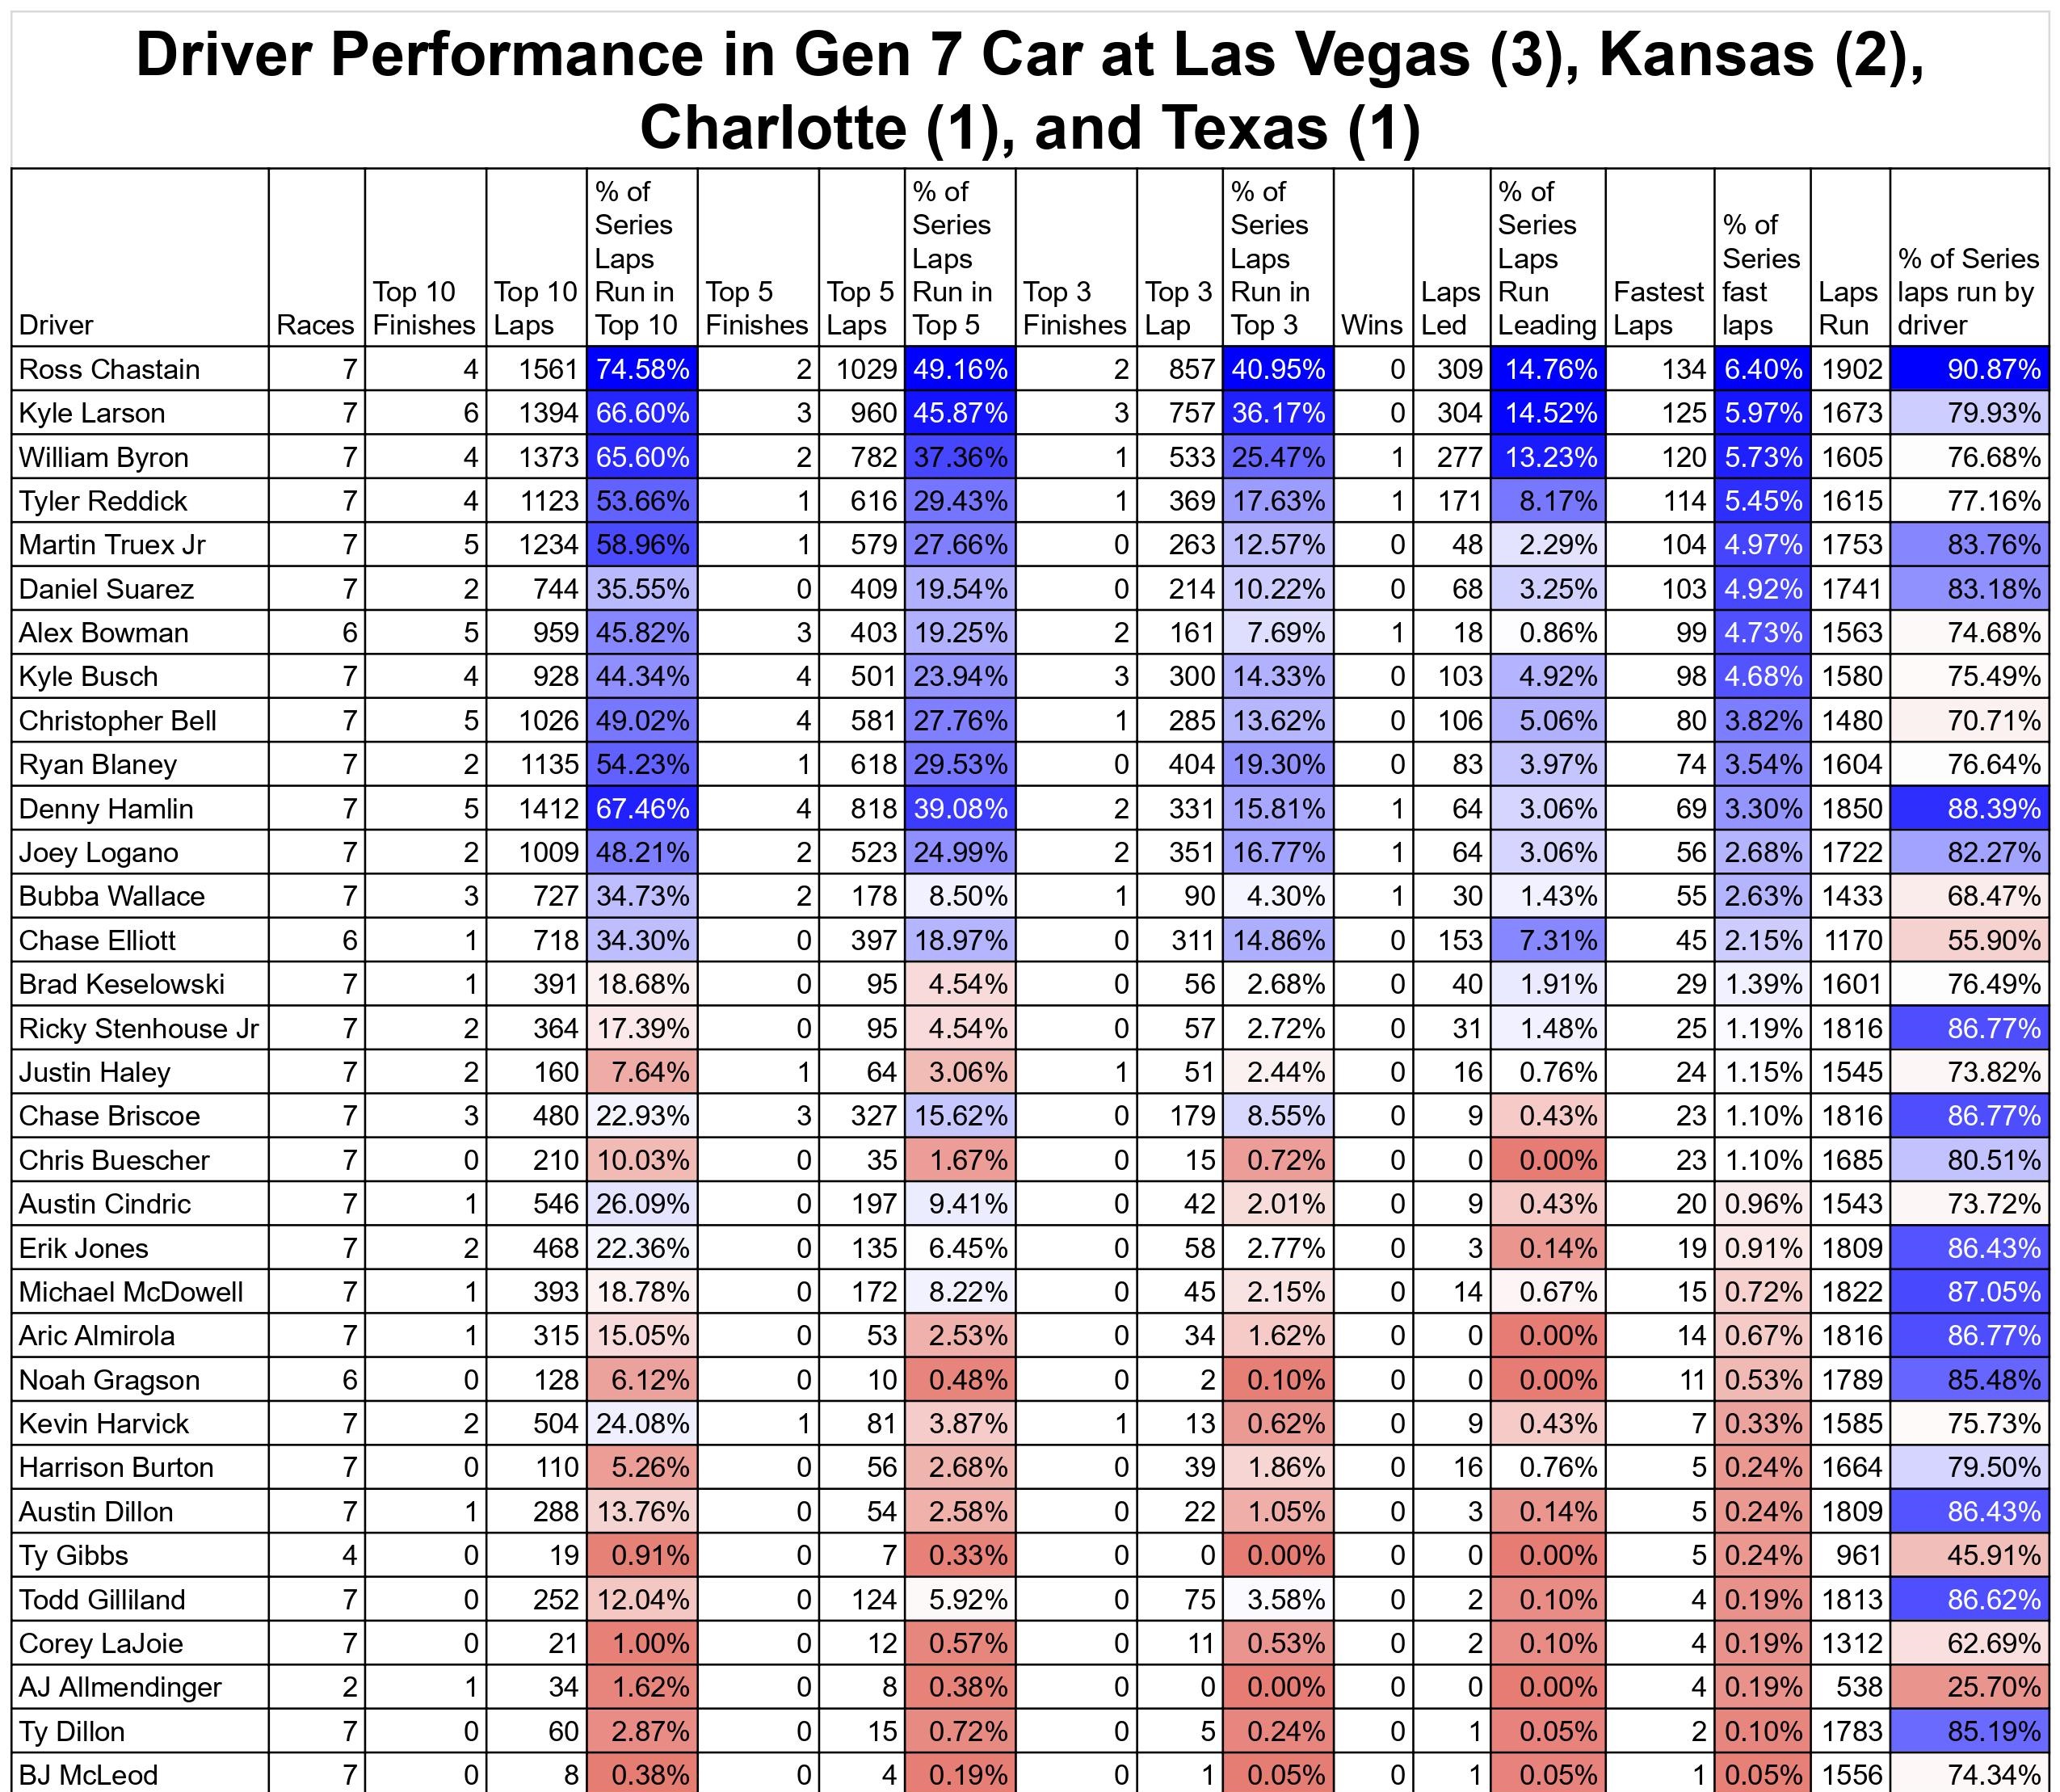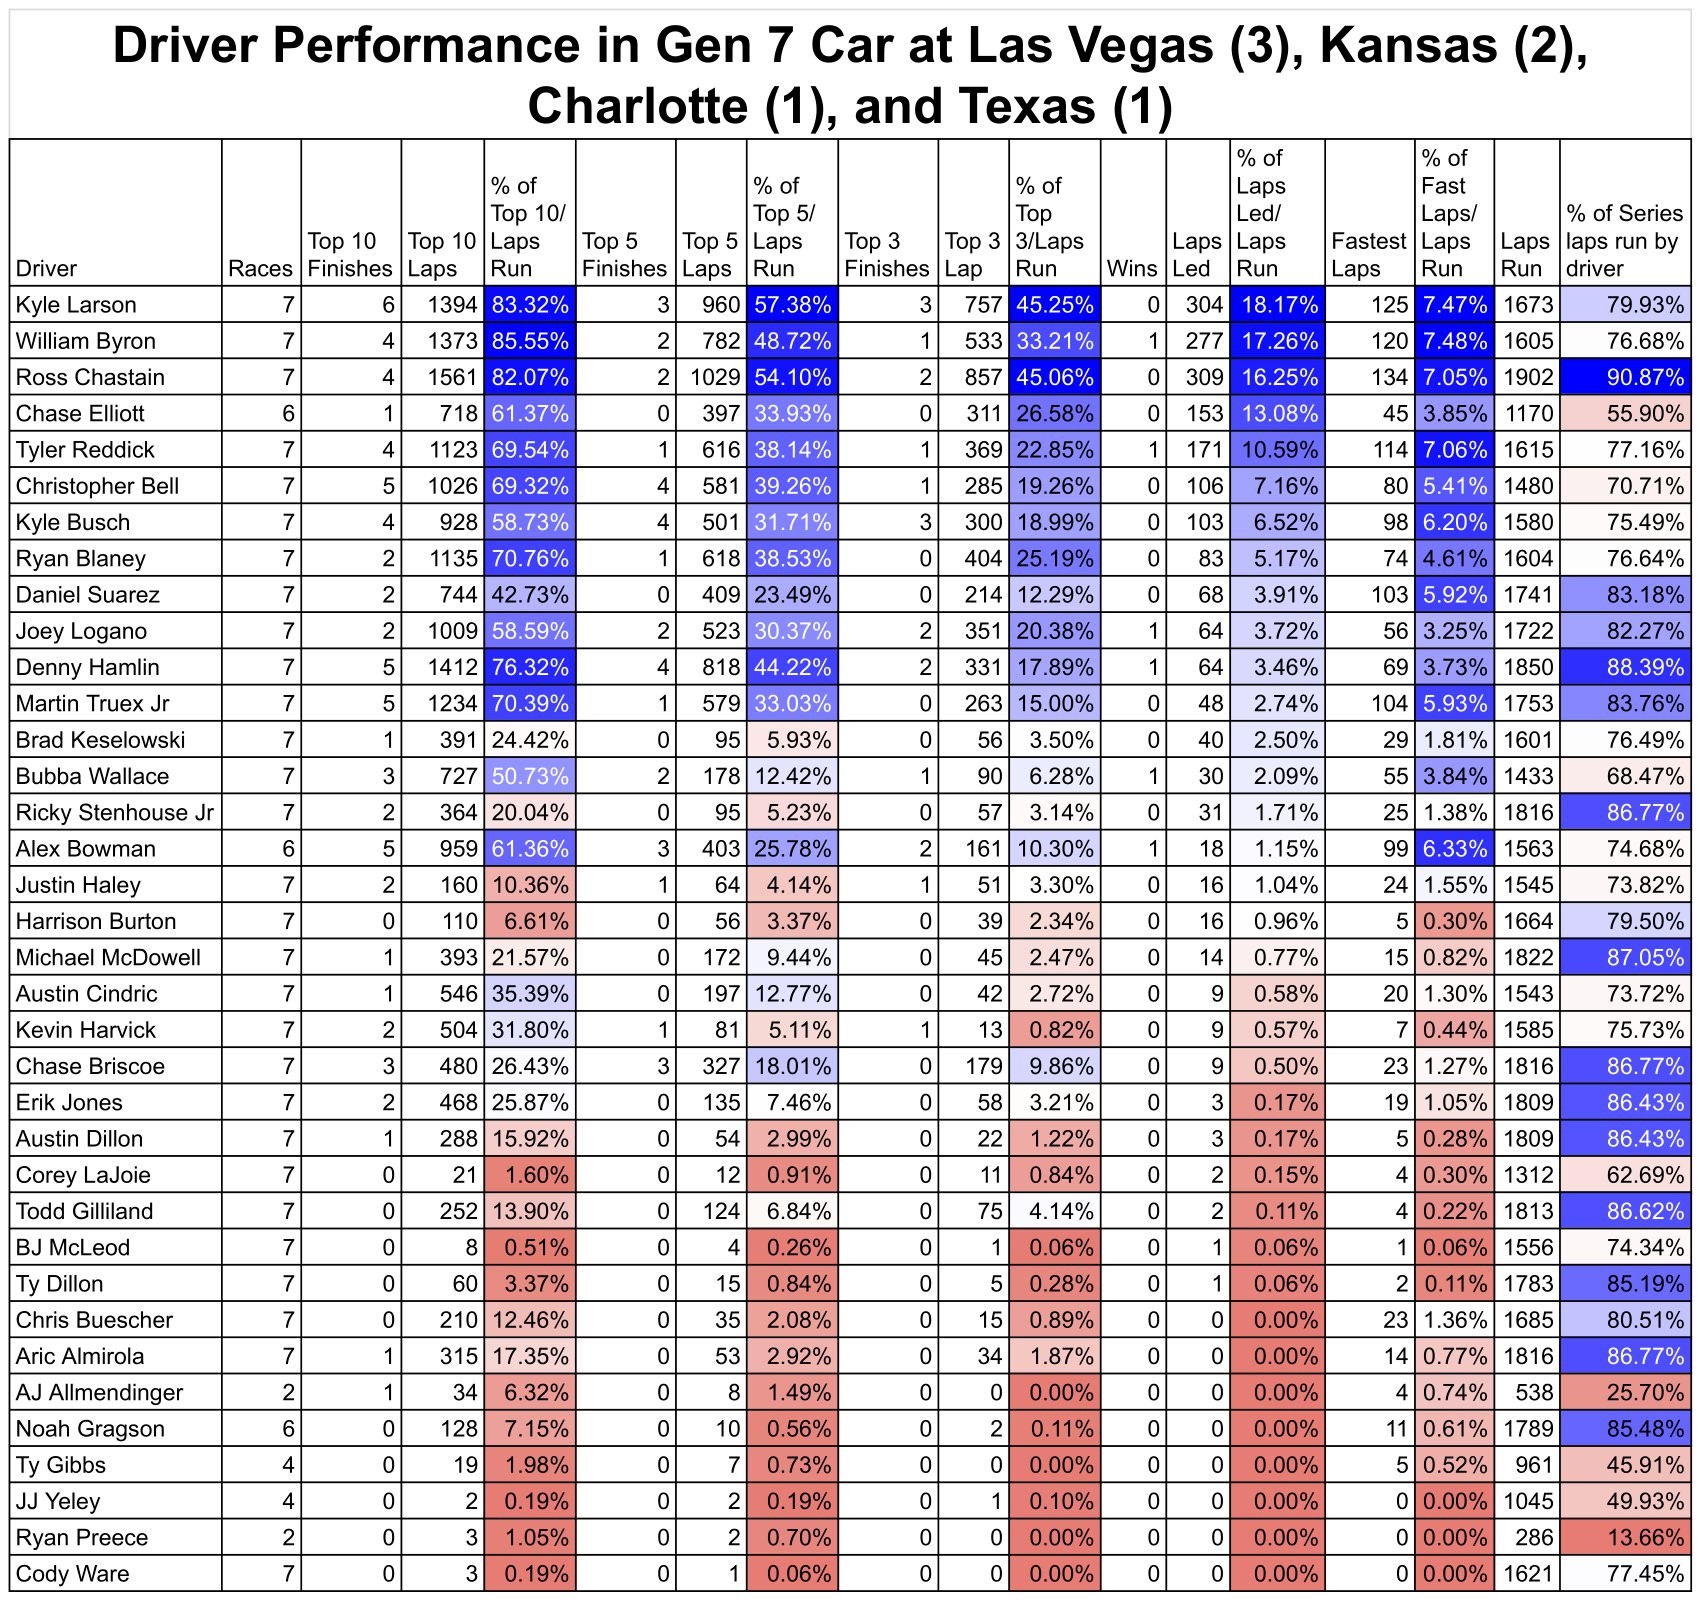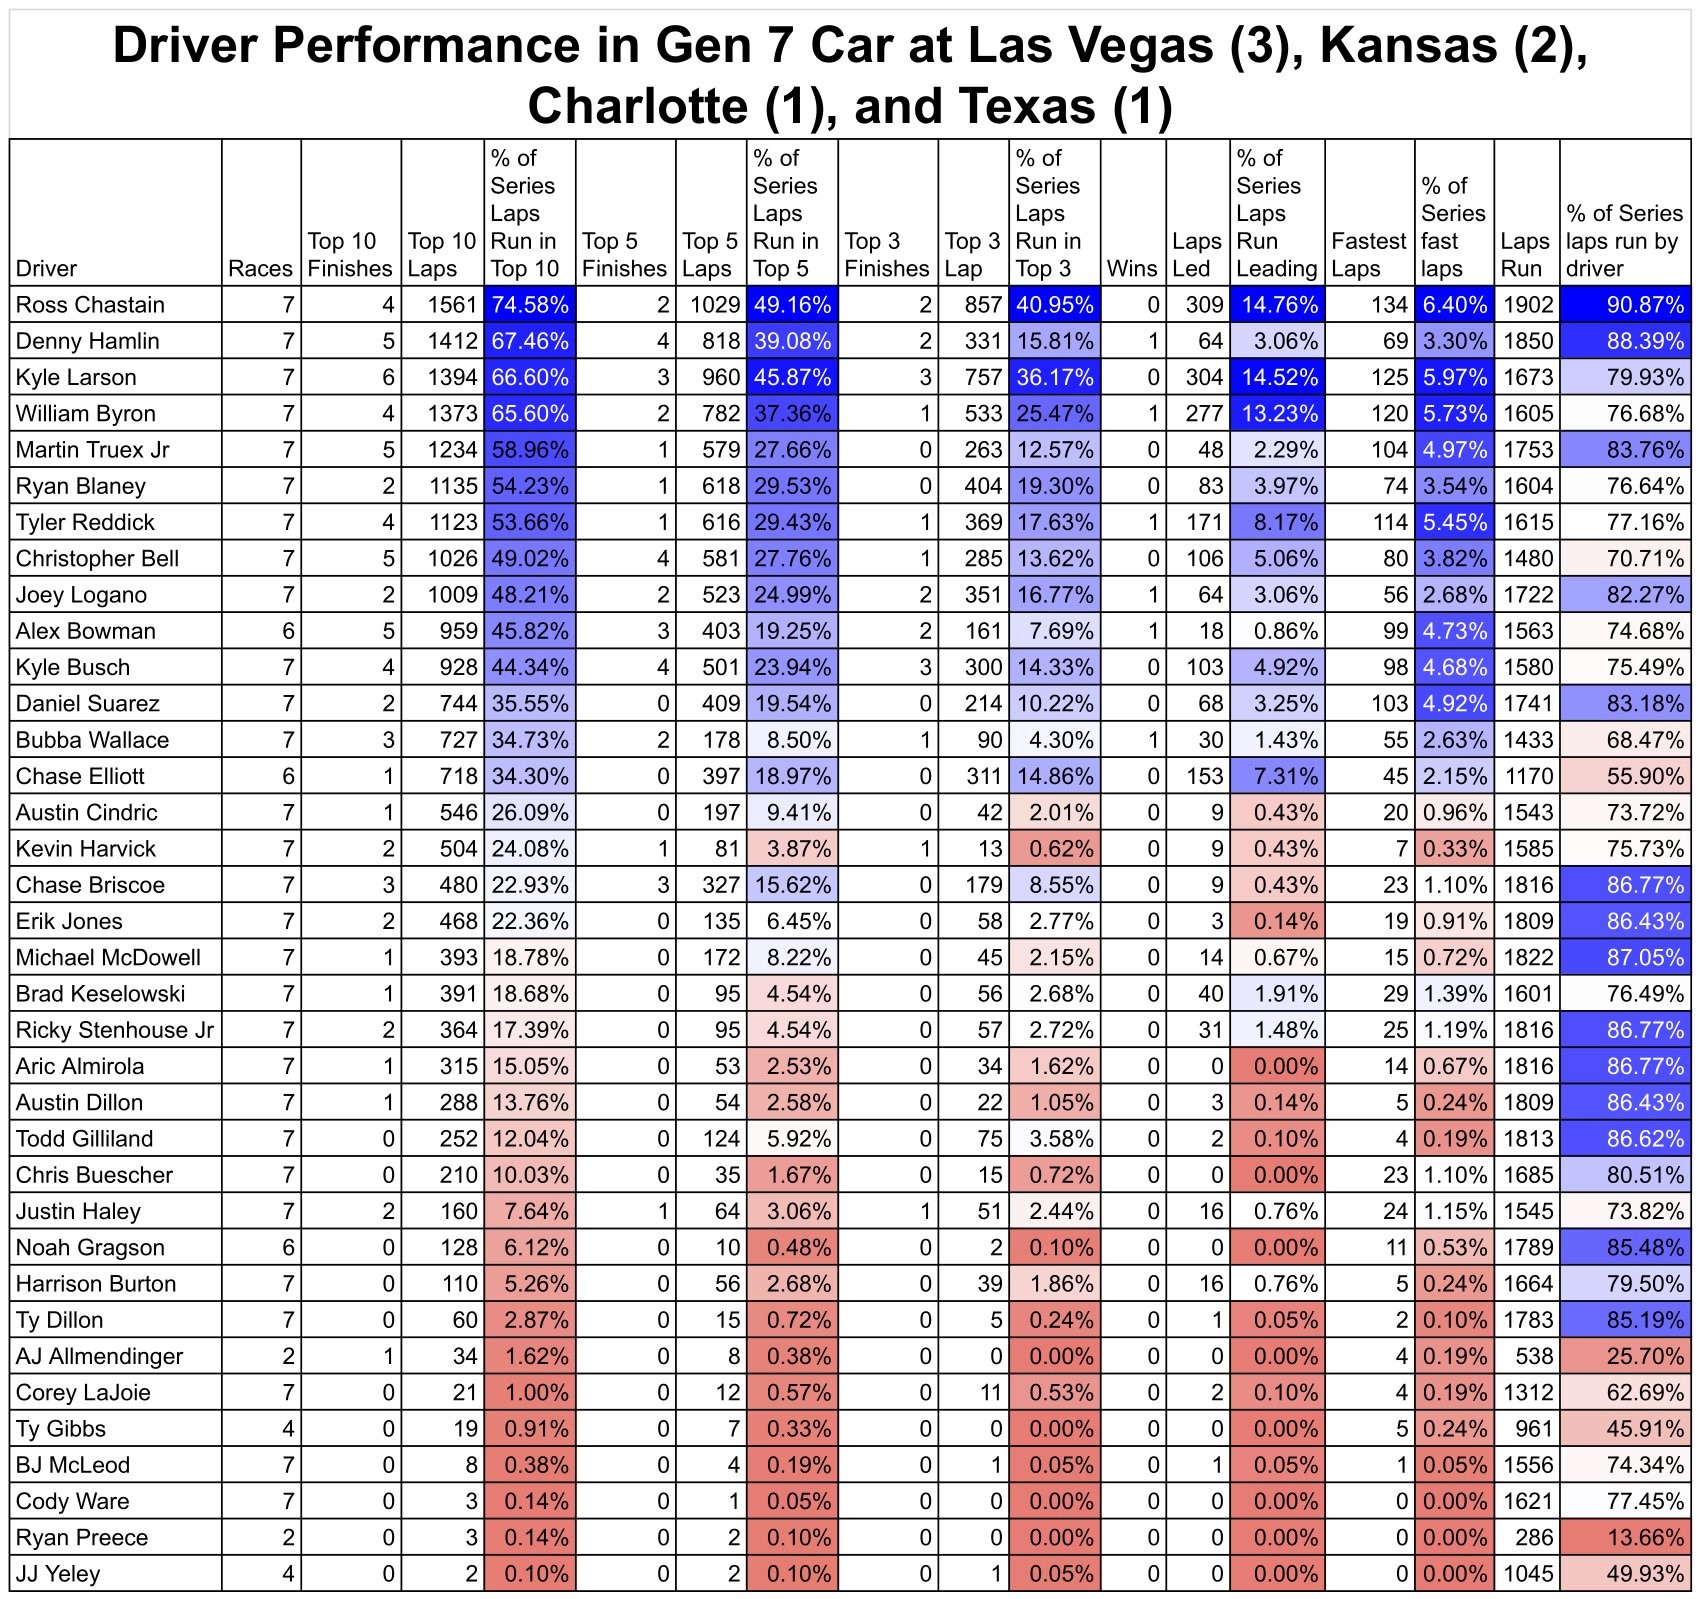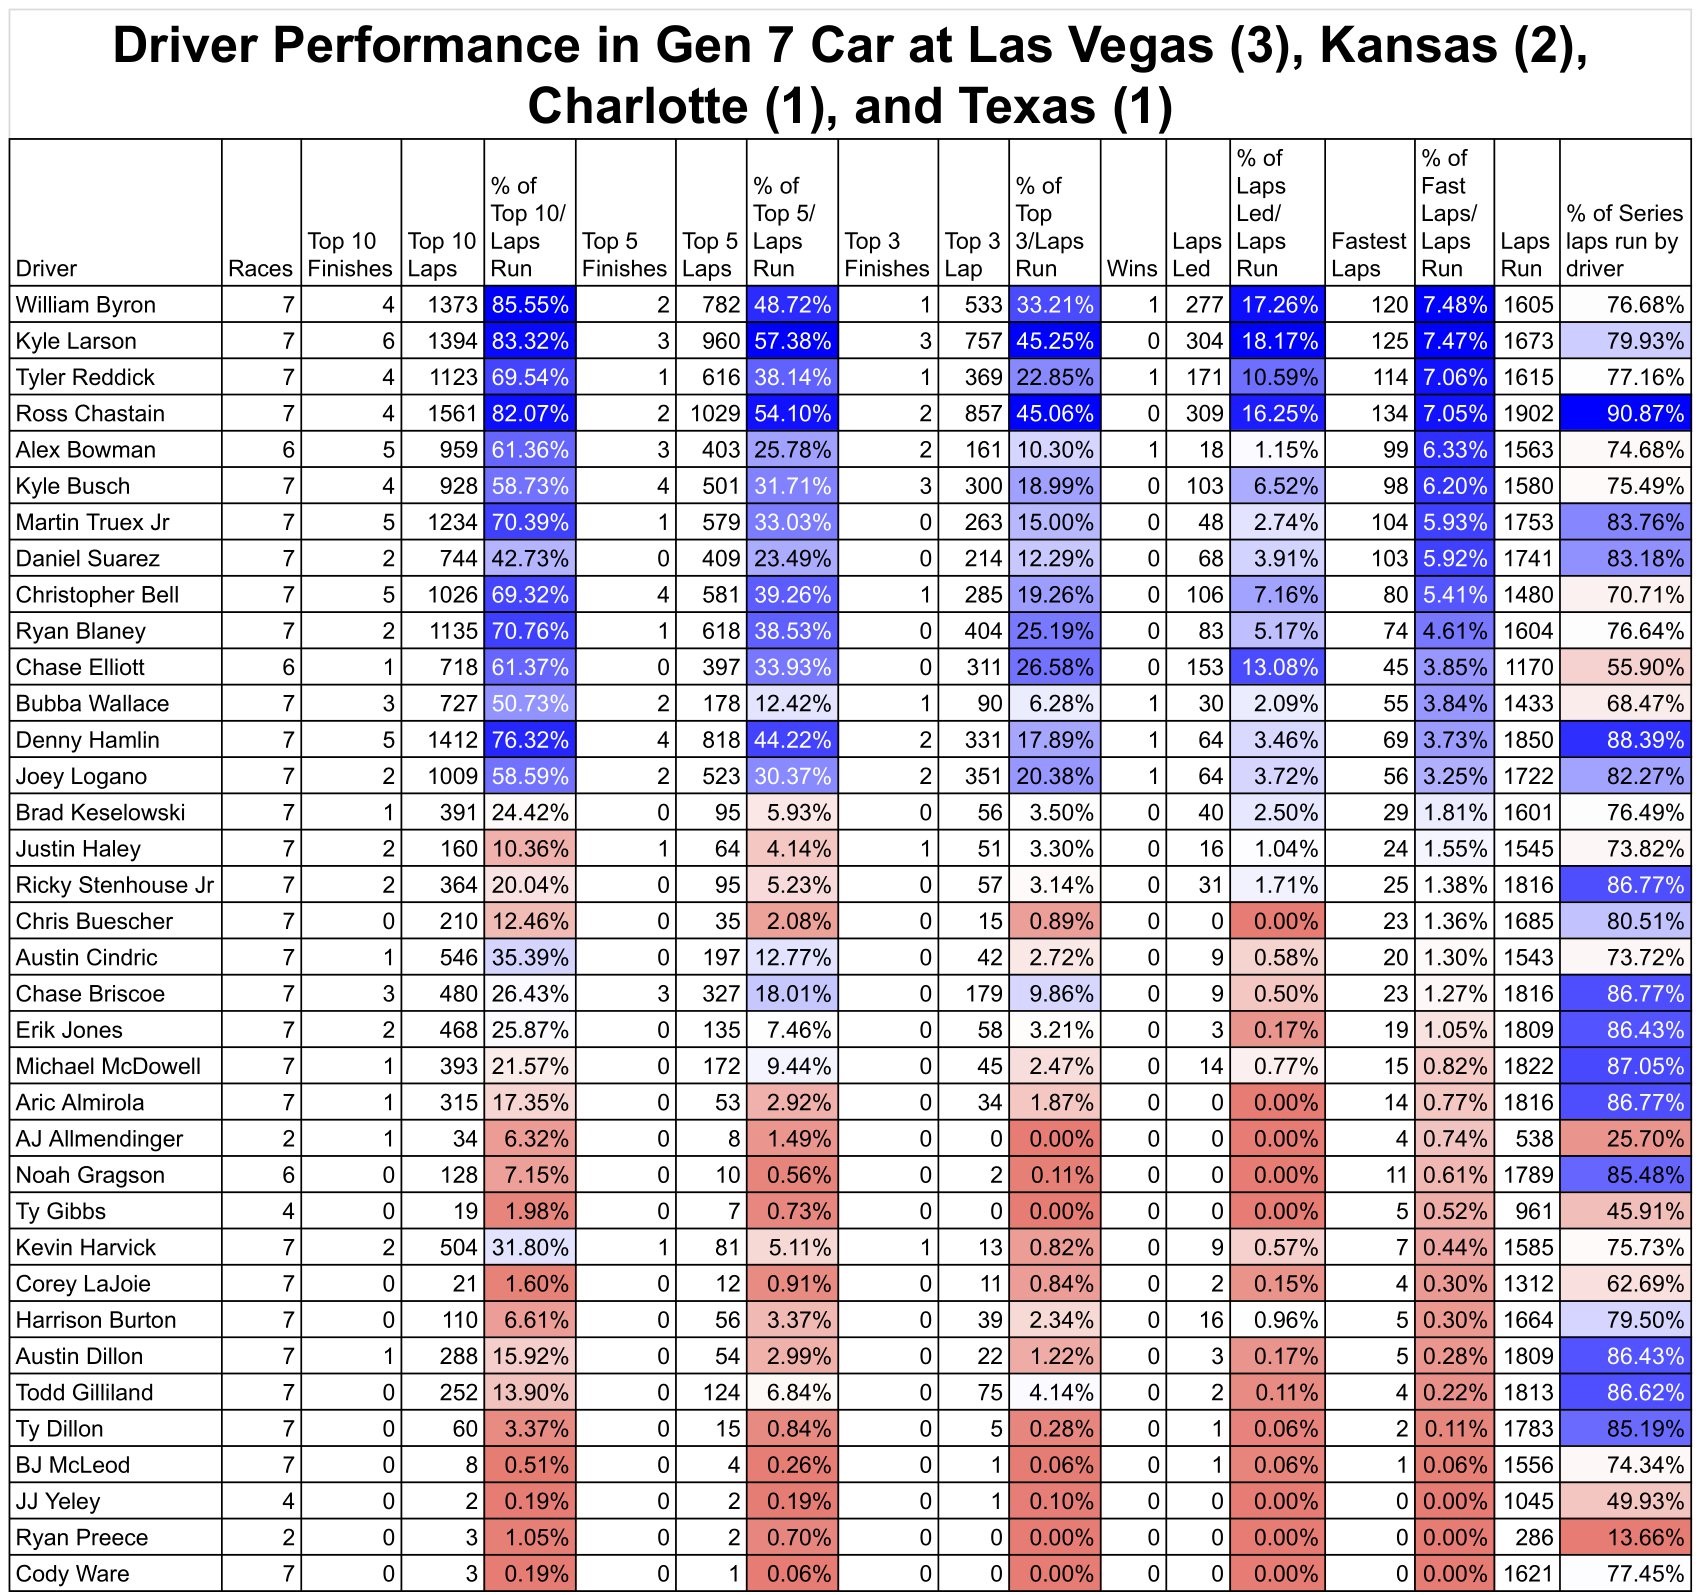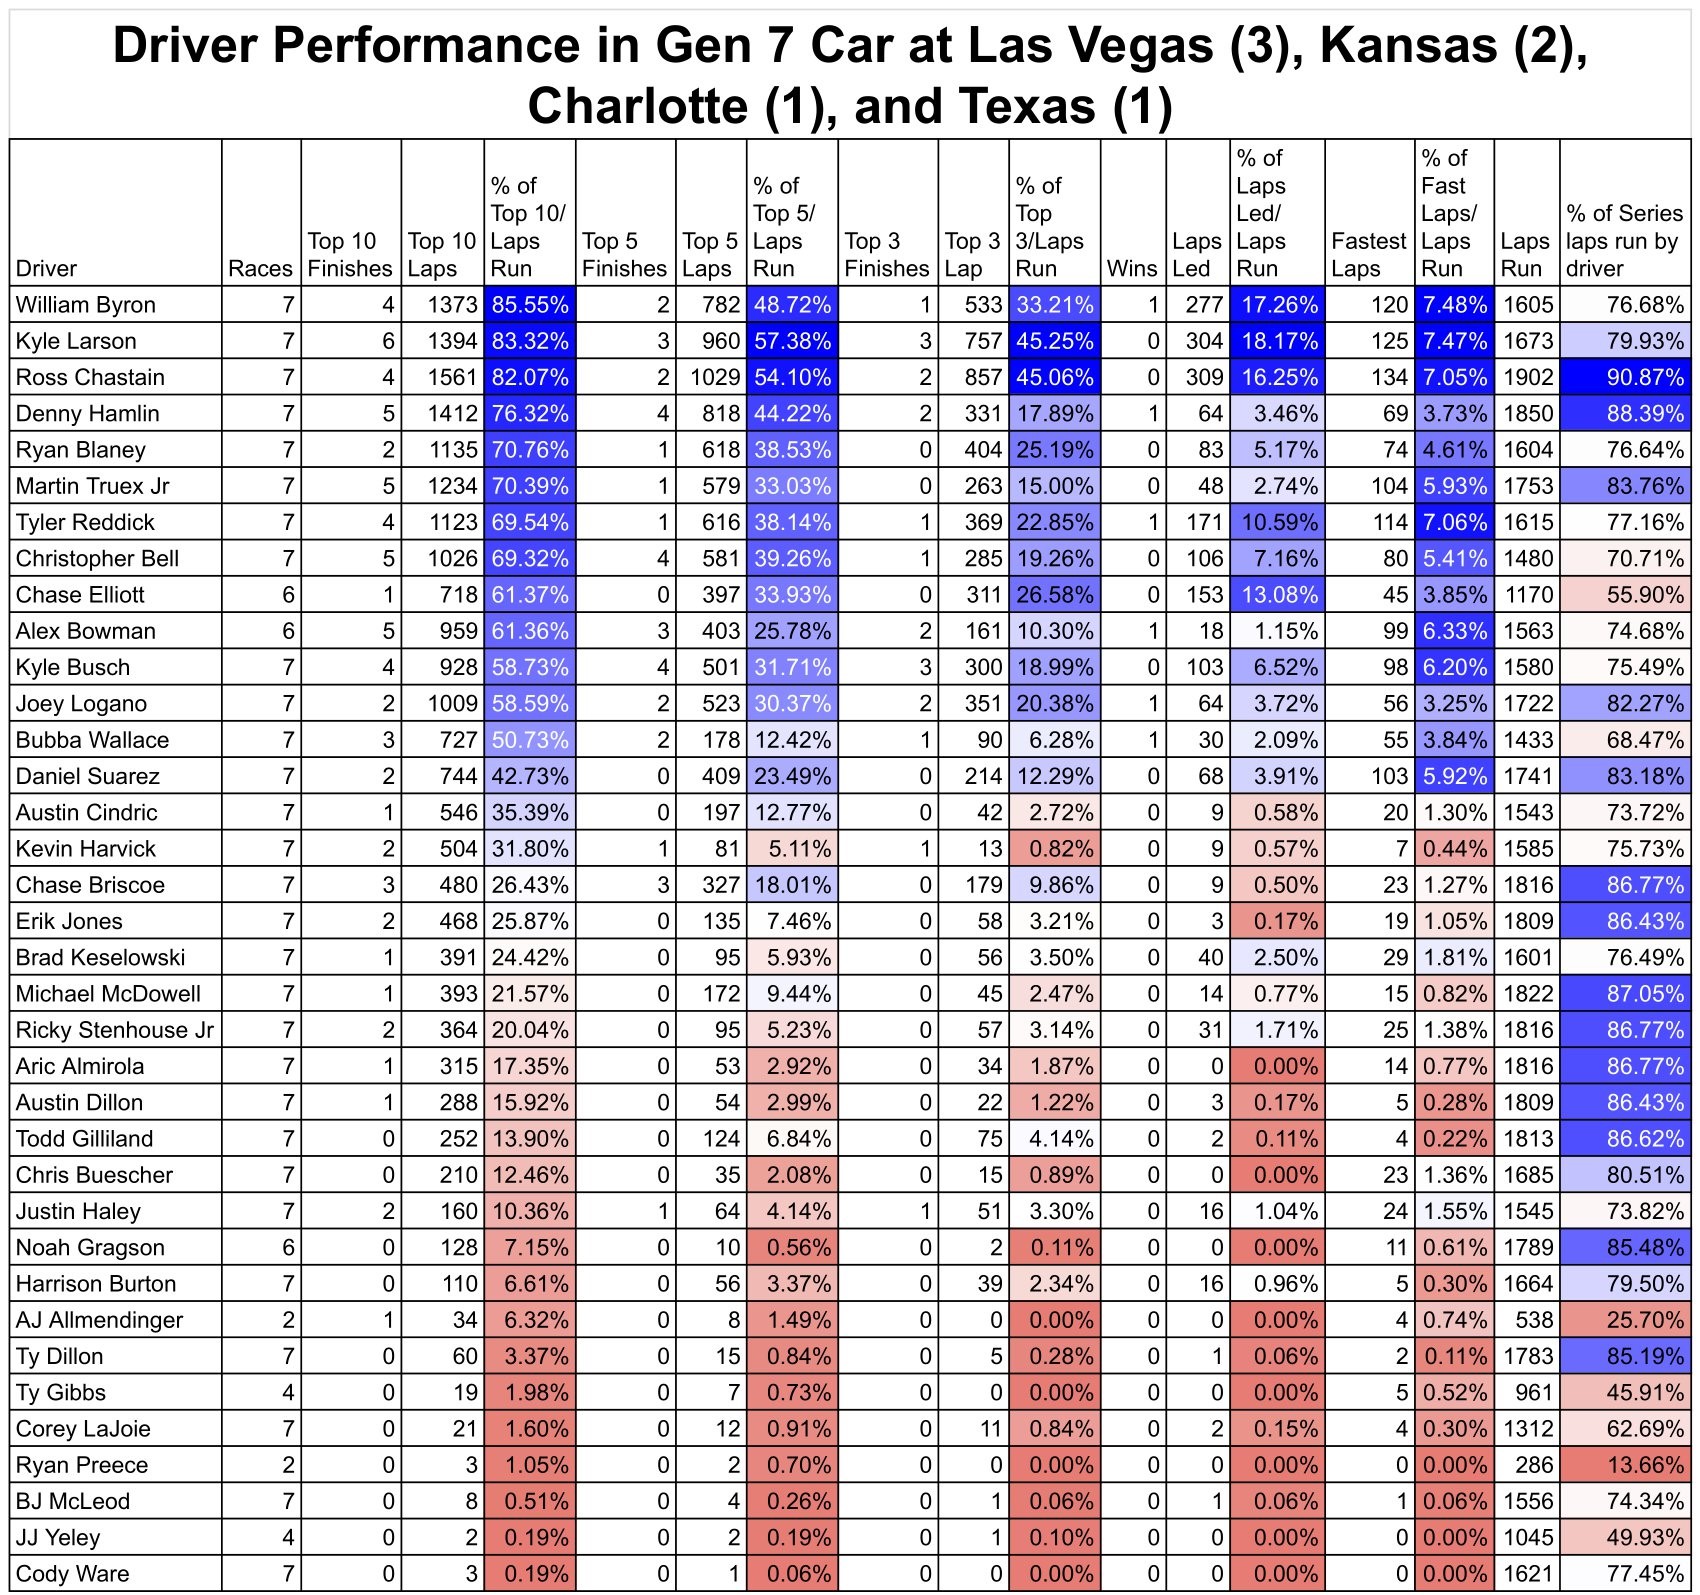


As the Cup Series heads to Kansas Speedway for the AdventHealth 400, I thought it might be helpful to look back on the growing data set we have on the Cup Series drivers at this track type. I’ve taken the number of laps each driver has run inside the Top 10/5/3 and led, as well as fastest laps run and calculated the percentage of laps for those particular categories two ways. First, as a percentage of total laps the Cup Series has run on 1.5-mile tri-ovals. Second, as a percentage of the laps that particular driver has completed on 1.5-mile tri-ovals. I’ve then sorted the charts three ways, by percentage of fastest laps, percentage of laps led, and percentage of laps run in the Top 10.